Chatoyance was evaluated in some samples where bark could be evaluated.
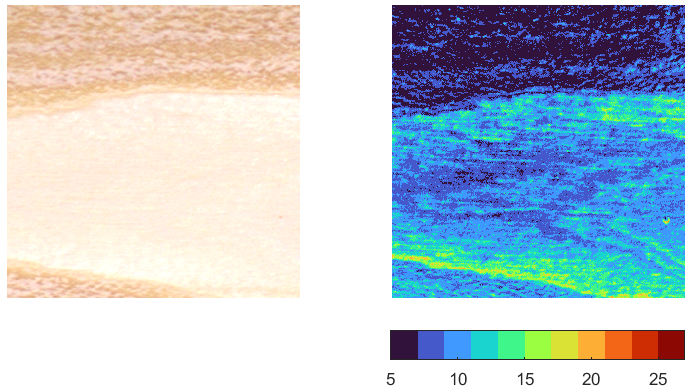
In the first sample (Acacia Dealbata), it would seem that bark has very high P values which, due to its dark colour, turn into relatively low PZC values:
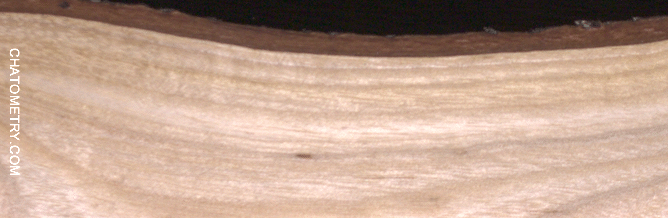
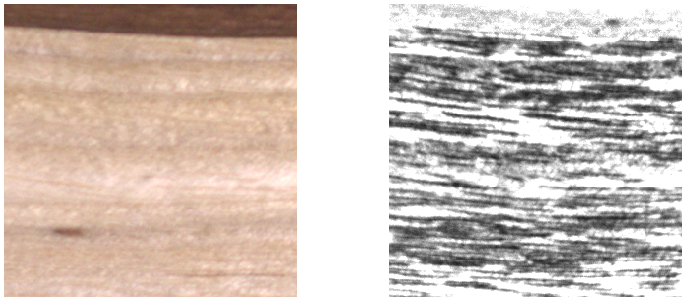
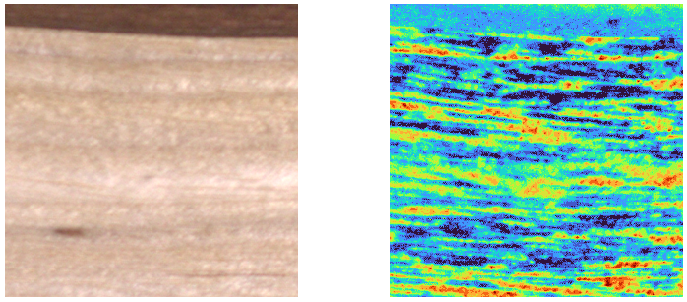
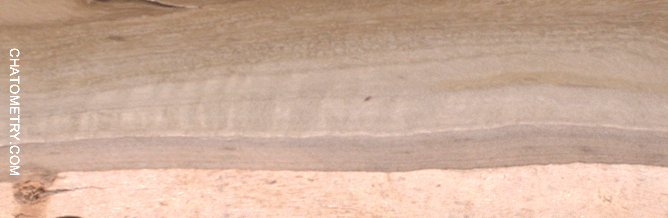
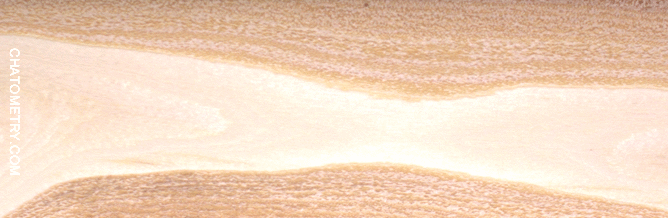
One more “lucky” acacia sample provided a view on a flat bark area which could be sanded and analyzed as if it were solid wood:
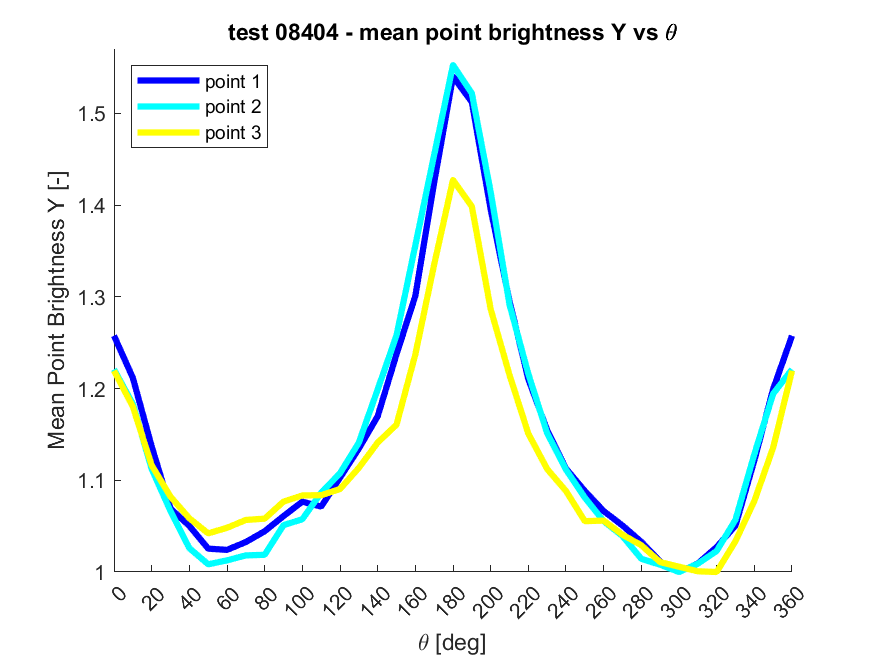
The P chart still shows the 2-peaked behaviour that is typical for wood:
One more example could be obtained on Eucalyptus Globulus:
In this case chatoyance seems to be lower in the bark layer, but still there:
This Acacia Melanoxylon sample provides the same result: a two-peaked chart on a tangential bark surface:
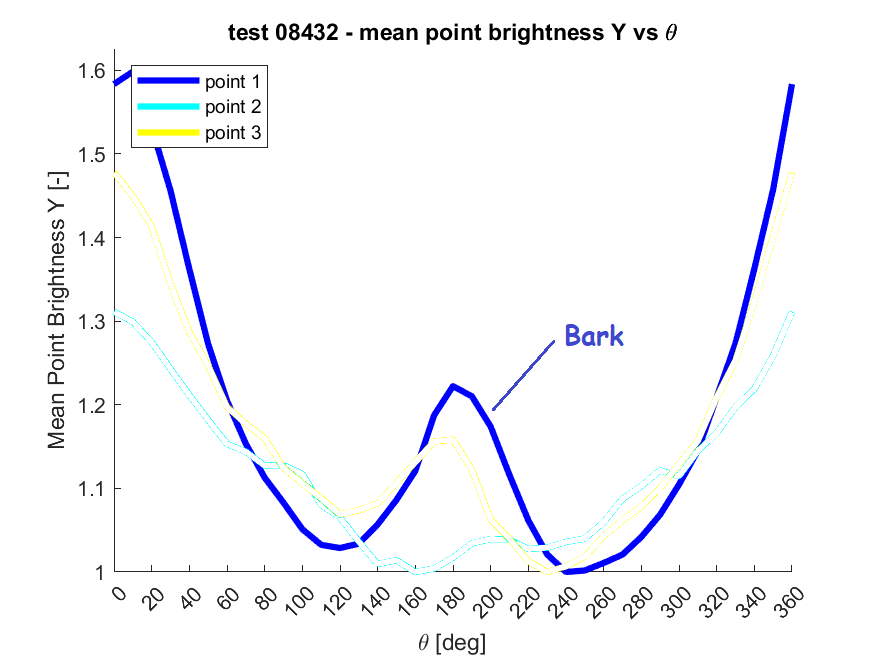
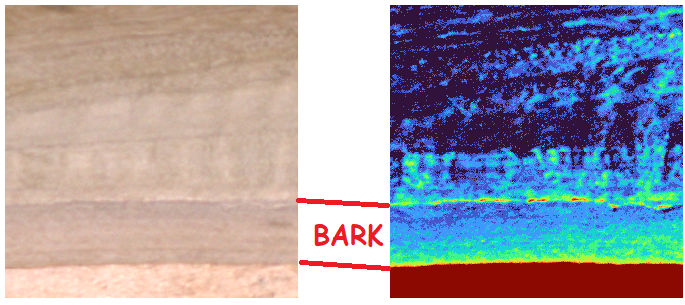
This Silver Birch (betula pendula) shows significantly lower chatoyance in the bark layer:
Want to know more? Get Woodworker’s Guide to Chatoyance!
Available on Amazon in 12 countries – just click on your flag below…
 |  |  |  |  |  |
 |  |  |  |  |  |
… and enjoy the read!